Hitting a million
Posted: May 26, 2016 Filed under: Housebuilding | Tags: Brandon Lewis, Queen's Speech 2 CommentsOriginally published on May 26 on Inside Edge 2, my blog for Inside Housing
Statistics published on Thursday provide the first clues as to whether the government will be able to deliver a million new homes in this parliament.
Transformed from an ‘aspiration’ into a ‘commitment’ in the Queen’s Speech, the million homes target will be a stretch but not quite as big a leap as it seems at first glance.
The DCLG housebuilding figures show homes built between January and March 2016 and therefore cover year one of this five-year parliament.
The bad news for the government is that the quarterly totals for starts and completions were down both on the previous quarter and on the same quarter a year ago. The figures show a particularly sharp fall in completions by housing associations, perhaps reflecting the transition from one affordable homes programme to another, but private sector completions were also down on the previous quarter:

The good news is that year-on-year totals are still rising. Starts are levelling off but although the annual total for completions is down slightly on the December quarter it is still 12% ahead of this time last year:

However, the 140,000 new homes completed in 2015/16 is still well short of the 200,000 a year needed to meet the commitment. So why are ministers so confident?
The answer is that they are using a different set of statistics for which these figures are only an early indicator: the net additional supply of homes.
So far these are only available for 2014/15, the last year of the last parliament, but they showed a much healthier total of 171,000 additions compared with just 124,000 completions in the housebuilding statistics.
Why the difference? Partly it’s because net additions include net conversions and net change of use, which seems quite reasonable if you want to know how many new homes there are in total. This adds around 15,000 homes to the annual total once you take off demolitions.
Partly it’s because net additions include a consistently higher figure for new build completions than the housebuilding figures. The difference was around 30,000 in 2014/15 and this is more puzzling.
Possible explanations include differences in the way the figures are collected. The housebuilding figures come from building control officers and it’s possible that some private inspections get missed or collection is delayed. The net additions figures come from local authorities and so are more comprehensive but councils have also had an incentive to find additions because they attract new homes bonus.
Confused? You’re not alone. As Daniel Bentley pointed out last week, even Brandon Lewis gets his figures mixed up sometimes. Twice recently the housing minister has said 181,000 new homes were built last year, which is gross additions before taking off 10,000 demolitions. He’s then compared that to the lowest housebuilding starts total under Labour to get the most dramatic comparison.
Whatever the reasons, using net additional supply does move the government much nearer to its million homes commitment. As an illustration, and this may be one reason for ministers’ confidence, one five-year period in the mid-2000s saw net additions total 999,000. The total in 2003/04 was 171,000 (the same as last year) and it rose steadily to a peak of 224,000 in 2007/08:
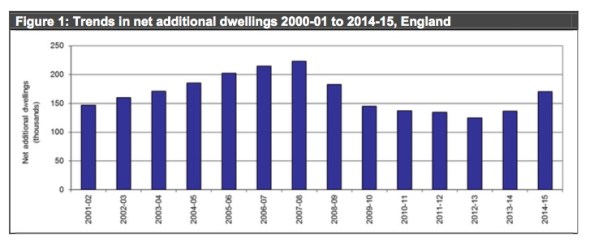
Today’s housebuilding figures show 140,000 completions in 2015/16, which implies net additions willl total around 185,000 when the figures are published later this year. On that basis, this parliament could be on course for a similar growth rate as in the mid-2000s, allowing ministers to meet their commitment.
But before ministers get too over-confident and housebuilders get worried about having to deliver the statement of intent they signed up to earlier this month, here are five quick notes of caution.
First, that assumes that there will be no recession or external shock to knock the recovery off course, in which case all bets are off. Brexit is just one potential threat.
Second, much of the future growth could depend on the government’s plans to cannibalise the stock of affordable homes to finance ‘replacements’. As the Council of Mortgage Lenders pointed out recently, current plans imply that the last three years of the parliament will see 200,000 starter homes and 135,000 shared ownership homes. That would represent 78% of current new build completions in that period, which the CML says seems ‘a very improbable outcome’ if they are really going to be additional.
Third, it wasn’t quite a commitment, but when Grant Shapps was housing minister under the coalition he set a ‘gold standard’ of building more homes than Labour. He might have had reasons to be confident too, given that output had plunged midway through Labour’s term after the credit crunch in 2007. However, the coalition eventually managed just 704,000 net additions, compared to the 2005-2010 Labour government’s 970,000.
Fourth, exactly how ambitious you see a million homes over five years as being depends on the context. It’s a big increase over the coalition but only a small one on a government that ministers regularly accuse of presiding over the lowest housebuilding since the 1920s.
Fifth, even a million compares to an estimated need for 245,000 homes a year and probably even more now. England would still be short of what’s needed to house a growing population and meet an ever-rising backlog of need.

Jules
I am sceptical around figures given as in my mind it is either creative accounting or a manipulation of statistics, I have lost faith in government produced so called facts as they are used to being spun to meet whoever is using them to promote their points of view by omitting chosen categories.
Manipulation of statistics by politicians? Surely not! But yes I agree – it’s legitimate to use net supply if the figures are more comprehensive but not ok to then choose the most unfavourable comparison with 2005-2010 Labout govt. on that basis the target is not very ambitious at all