What does ‘the biggest boost in a generation’ really mean?
Posted: March 19, 2025 Filed under: Affordable housing, Social housing Leave a commentOriginally written as a column for Inside Housing.
What’s not to like about the prospect of ‘the biggest boost to social and affordable housing in a generation’?
The promise often repeated by Angela Rayner is the best evidence yet that the Labour government’s ambitions for housing are about more than just its headline pledge of 1.5 million new homes in this parliament.
‘The biggest boost’ certainly sounds impressive, generational even, but (unless I’ve missed it) I have not seen an explanation of what it actually means. The answer – inevitably – is that it depends.
Does the deputy prime minister mean the biggest boost in investment or the biggest boost in the number of social and affordable homes? They are not quite the same thing – and there are other questions that flow from that.
In a similar vein, how does this relate to Labour’s broader target of 1.5 million additional homes over this parliament?
The government has sometimes given the impression that if the target be met (a very big if) then a big increase in affordable housing will inevitably flow from that via Section 106.
But all the evidence suggests that this is the wrong way around and that it can only hope to come close to 1.5 million homes if a significant proportion of them are affordable.
To begin with, though, a generation is usually taken to mean 25 to 30 years. That takes us back to 1995/96, when output had reached a record high of almost 75,000 social and affordable homes in the wake of extra investment during the housing market crash.
The rest of the 20th century saw Labour cutting investment after 1997 in line with its pledge to stick to draconian Tory spending plans in its first two years in office before funding increasingly significant increases in its second and third terms.
After 2010 the Conservative-led coalition slashed spending and ceased funding social rent altogether. Investment recovered after the Brexit vote in 2016 and social rent was rehabilitiated but on nothing like the same scale as before.
This graph based on data from the UK Housing Review shows annual outturn investment by the Homes England (and predecessors) and the Greater London Authority in new affordable homes over the period:
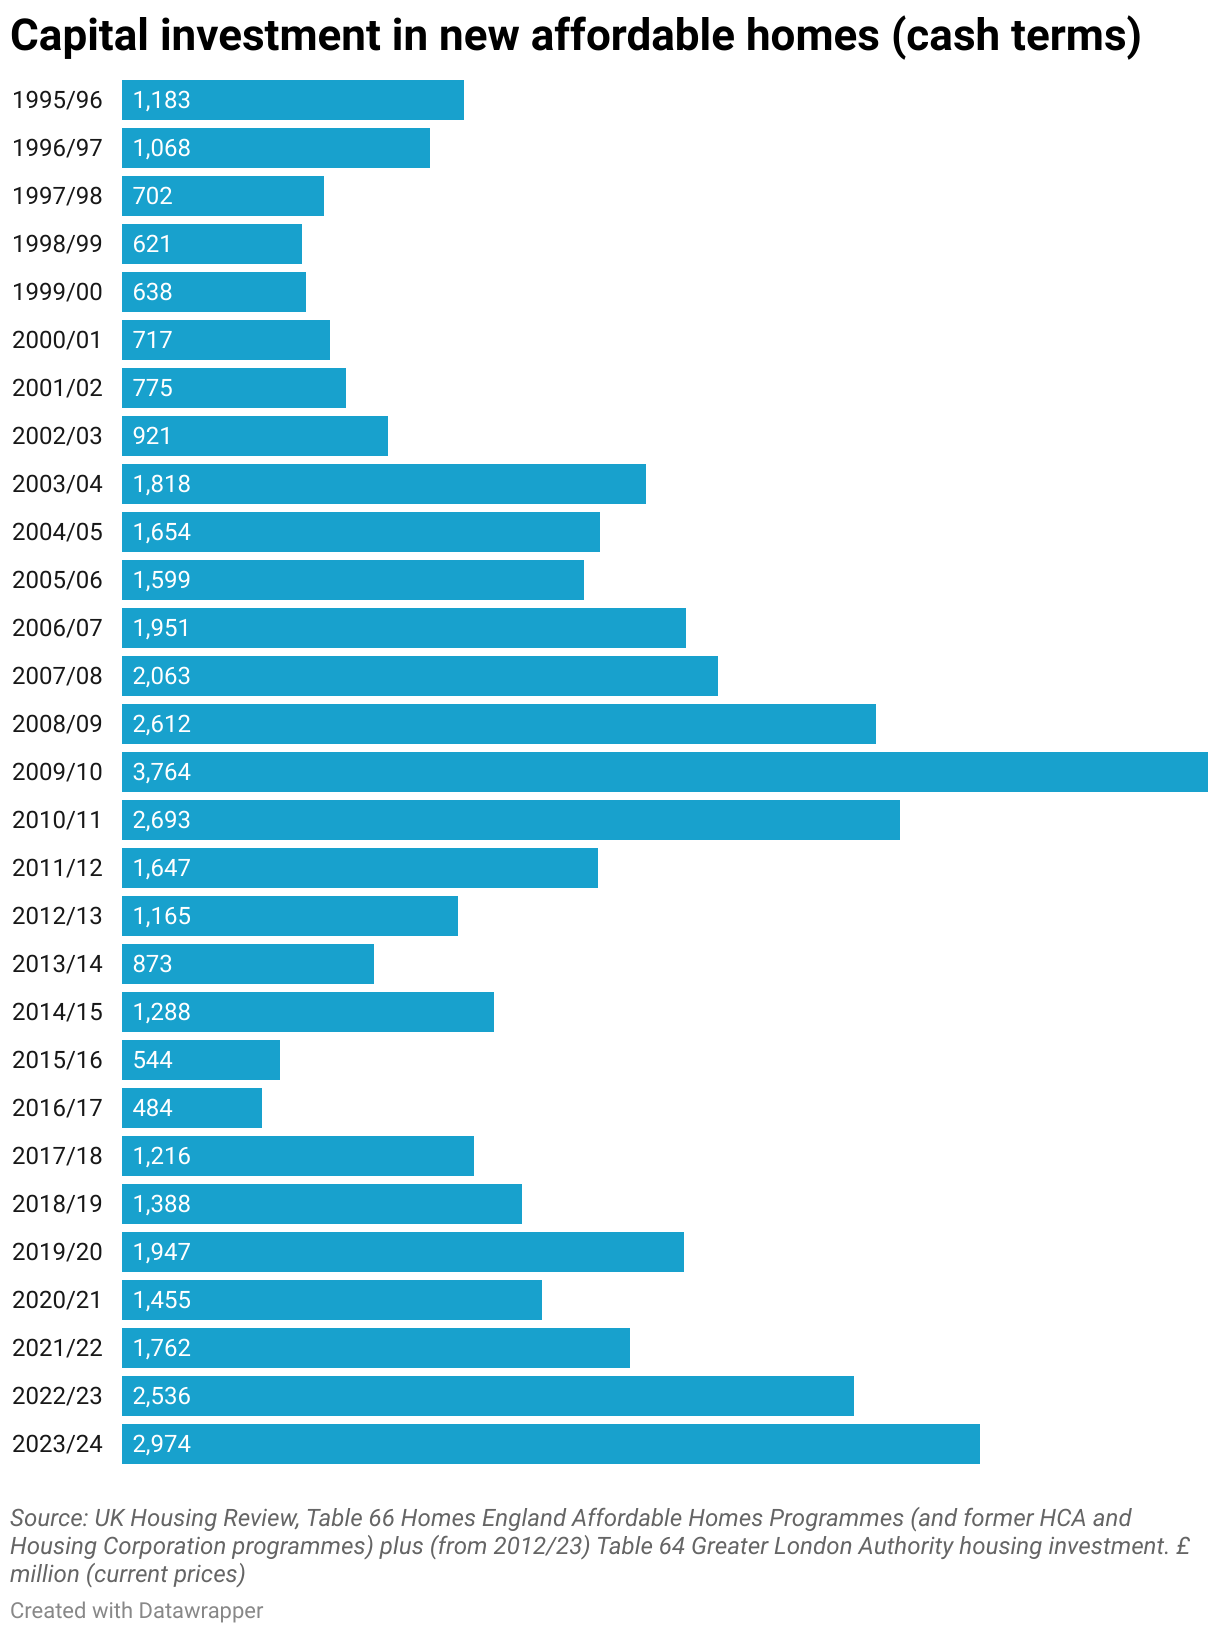
On this basis, the peak for investment was 2009/10 and 2023/24 was the next biggest. Add the extra £800 million the chancellor has found down the back of the sofa for 2025/26 and we arguably already have ‘the biggest boost’.
But that takes no account of inflation and would be completely misleading in the same way as government claims to be spending ‘record’ amounts on things.
With thanks to Gillian Young of the UK Housing Review, here is the same graph in 2023/24 prices:
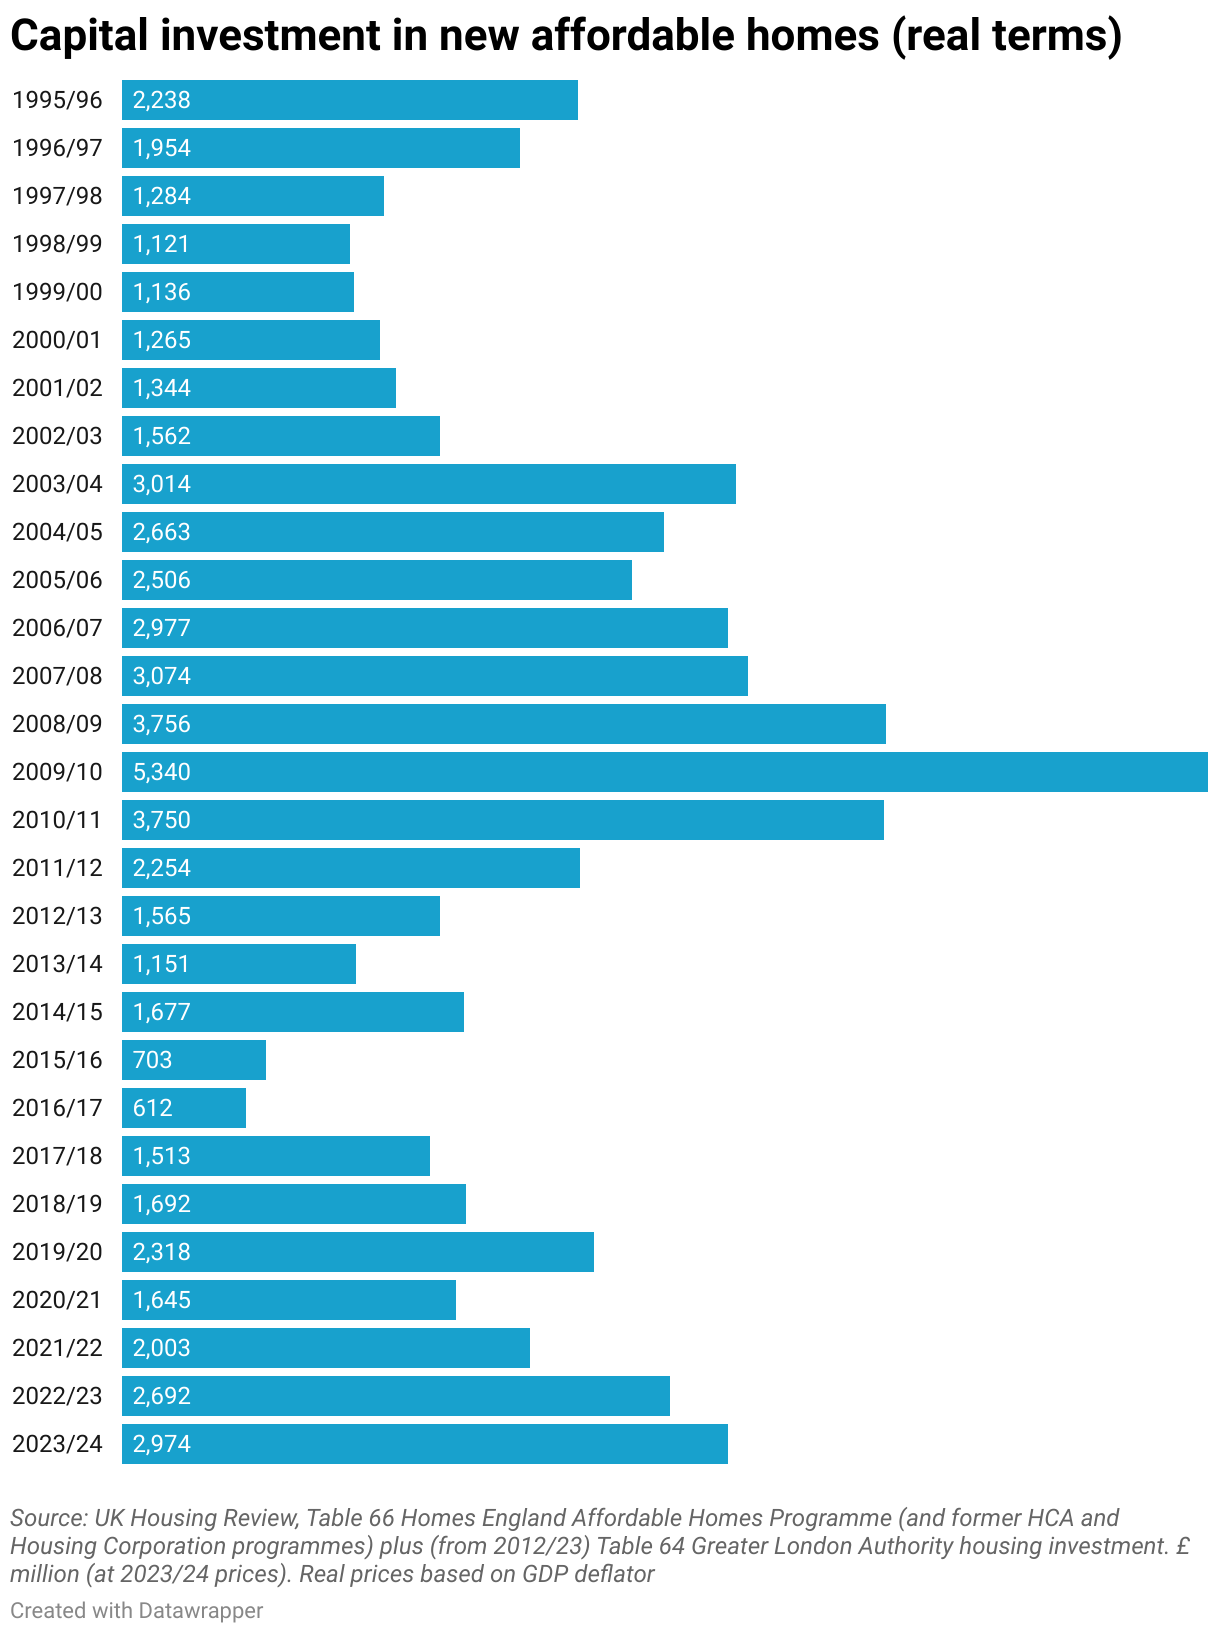
A very different picture emerges when it is viewed in real terms. The peak was still in 2009/10 but investment would have to rise by 80 per cent from 2023/24 levels to match it. Quite a challenge for the spending review in June.
Another way of thinking about investment is to compare different spending review periods. The first of these in 1998 covered the three years from 1999/2000 and saw spending fall by 14 per cent in real terms compared to the previous three.
The next four Labour spending reviews in 2000, 2002, 2004 and 2007 all saw large increases in investment (it almost doubled in real terms as a result of the 2002 review but this was from a low base).
By complete contrast, the coalition’s spending review in 2010 saw investment fall by 61 per cent in real terms over the next five years compared to the previous five.
We could also look at performance in different parliaments and on this basis ‘the biggest boost’ achieved over the period was by the Labour government between 2005 and 2010. The current one would have to double investment in real terms by 2029 to match that.
However, this does not tell the full story either, since these real terms figures reflect increases in general inflation, not the larger increases seen in land and construction prices that mean the current Affordable Homes Programme is set to deliver far fewer than the 180,000 homes originally expected.
The figures also show total government grant towards affordable housing and so do not include private finance raised by social landlords or contributions from developers via Section 106 agreements
So perhaps a better way to look at is to compare completions of social and affordable homes, which inevitably lag investment.
That is what is clearly implied in the government’s response to a housing committee report published earlier this month that recasts Angela Rayner’s ‘biggest boost’ as ‘the biggest increase in social and affordable housebuilding in a generation’.
This graph shows what has happened to completions over the last 30 years from all sources, including grant funding, Section 106 and social landlords’ own resources:
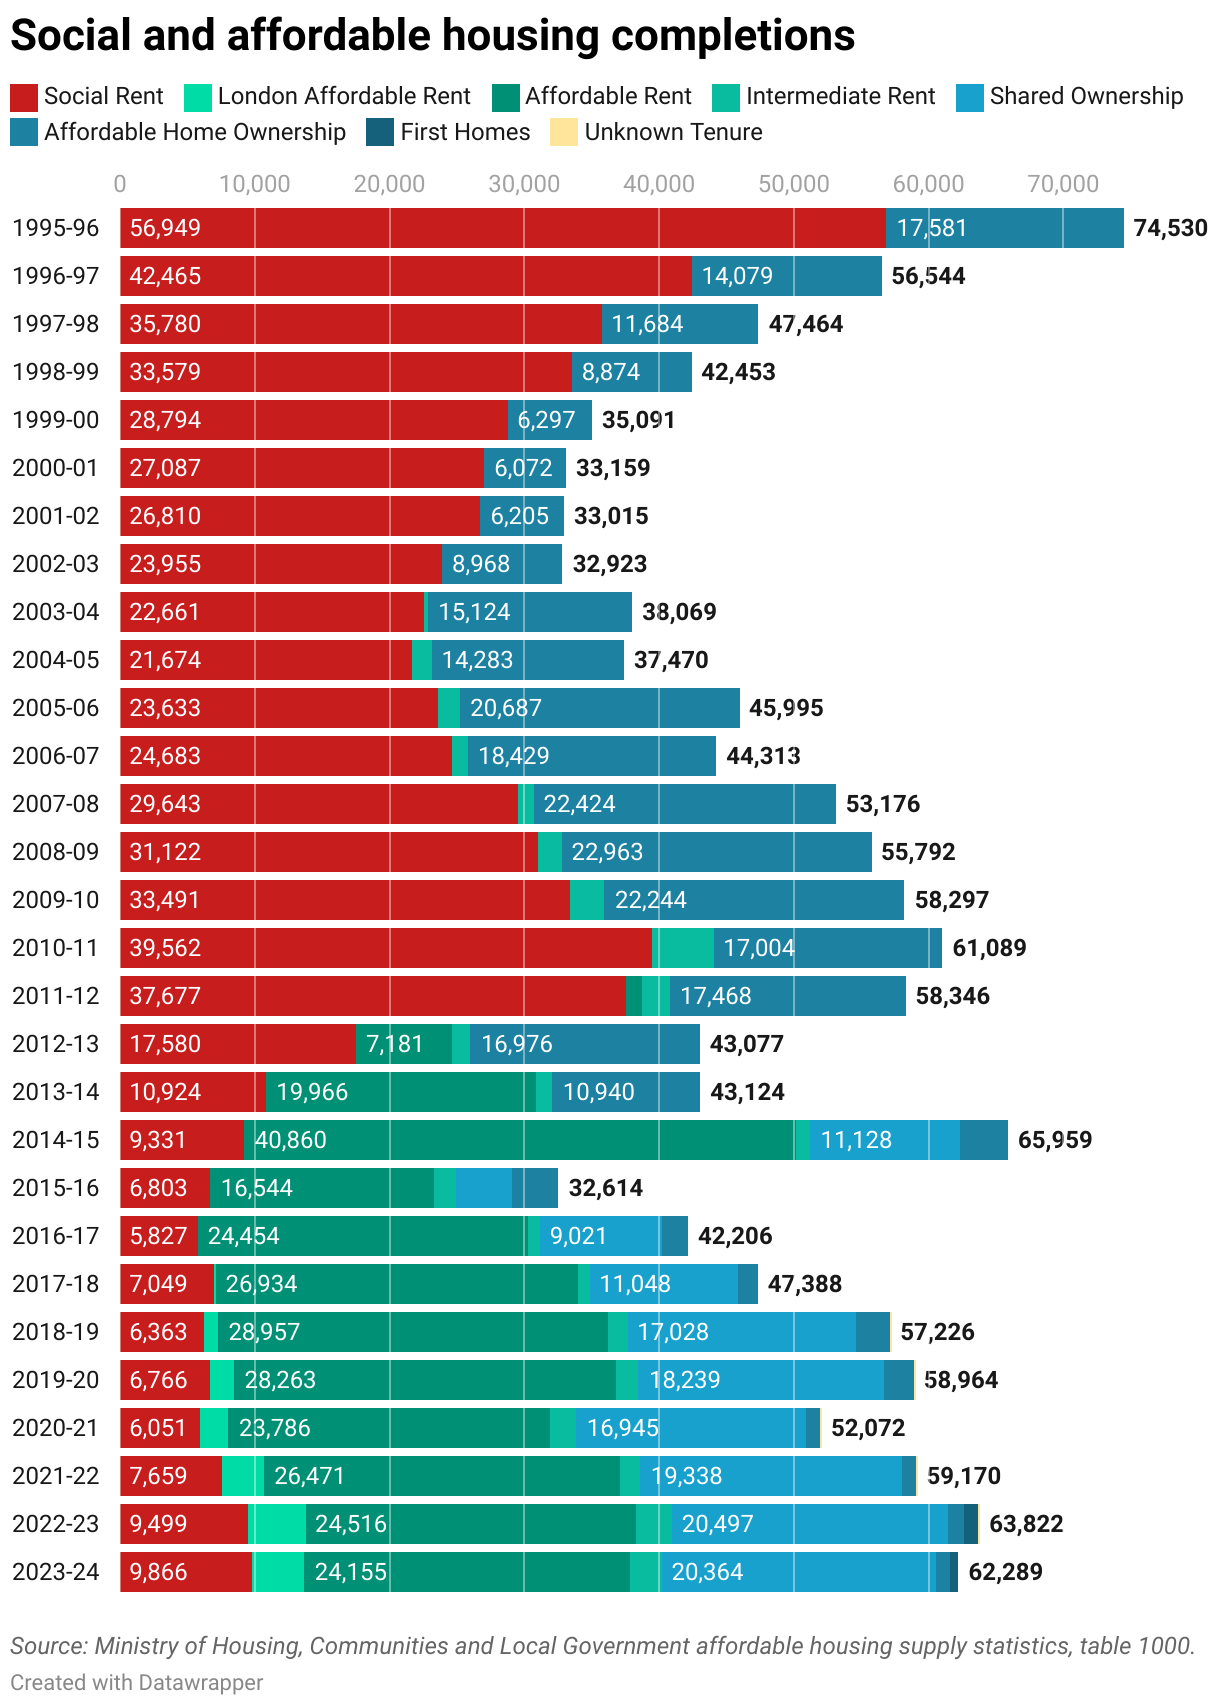
Here too the government could have a misleading (and weaselly) basis to claim it has generated the biggest increase without actually doing very much. Total output of social and affordable homes would have to rise by just 6 per cent on 2023/24 levels to beat the recent high of 2014/15 or 20 per cent to beat the 1995/96 peak.
But that would of course ignore the way that the Affordable Homes Programme shifted away from social rent (in red) to affordable rent (green) and affordable and shared ownership (blue) under the Conservatives between 2010 and 2024.
The Labour government has been clear (including in the response above) that it wants to see social rent take priority in the remainder of the existing AHP and in the new one.
If that means ‘the biggest increase in social AND affordable housebuilding’ there is much more work to do: the social rent numbers would have to rise three-fold on 2023/24 levels to match those achieved at the end of the last Labour government and almost five-fold to match the generational peak of 1995/96.
And annual output of affordable homes would have to rise by 46 per cent over this parliament to match the increase achieved by Labour in its third term between 2005 and 2010.
Even those highs, of course, would not be sufficient to generate the almost 500,000 affordable homes that analysis by Savills suggests could be needed to add to market output to meet the 1.5 million homes target over the five years of this parliament.
And they come nowhere near the 90,000 social rent homes a year now required to meet housing need, a figure endorsed by housing organisations and independent researchers and by the all-party Housing, Communities and Local Government Committee.
But any of these generational increases would be a pretty good start.
