The state of social housing
Posted: July 19, 2017 Filed under: Social housing | Tags: English Housing Survey Leave a commentOriginally published as a column for Inside Housing on July 19
Results from the English Housing Survey last week provide a detailed snapshot of who lives where and in what sort of conditions and how they feel about it.
The picture that emerges of social renting is not exactly a new one but it also confounds many of the stereotypes about the sector and the people who live in it.
Here is a baker’s dozen of the highlights that I picked out from the survey showing the state of the sector in 2015/16:
1) The overall picture: The social rented sector was home to 3.9m households in England – 2.3m with housing associations as their landlord and 1.6m with local authorities.
That total has stayed broadly the same for the last three years but the English Housing Survey does not separately identify a rising number of affordable rent properties (an estimated 123,000 by April 2015).
As home to 17% of households, social renting is now comfortably behind private renting (20%).
2) Age: The average age of the head of a social renting household is 52, which makes them younger than the average owner-occupier (57) but older than the average private renter (40).
The over-65s make up 27% of social renters compared with more than 40% in 1991.
The biggest increase has been seen among the 45-54s, who now make up 21% of social renters compared to 17% in 2008/09 and just 11% in 1991. Perhaps that reflects a bulge in allocations by housing associations when funding was expanded in the early 1990s?
3) Household type: Social renters more likely than people in other tenures to be living on their own, to have a female head of household and to be lone parents. In 2015/16, 39% of all lone parents with dependent children were social renters.
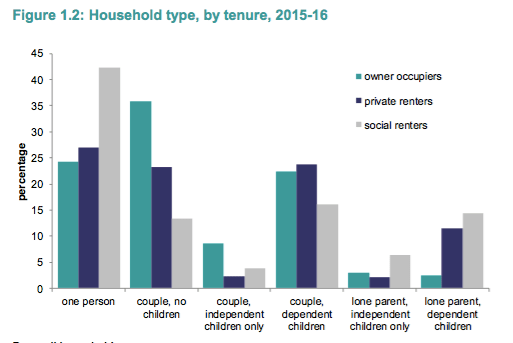
Despite that, the proportion of households with dependent children in social renting has fallen slightly in the last 10 years, from 36% to 32%. There has been a corresponding increase in families with children in private renting.
4) Under-occupation: Despite what certain government ministers may have told you, under-occupation is far lower than in other tenures. Only 10% of social renters met the survey’s definition of having two or more spare bedrooms, down from 12% in 1995/96.
In contrast overcrowding (7%) was more prevalent than in other tenures. Just 1% of owner-occupied homes are overcrowded.
5) Employment: While less than half (42%) of social renter heads of households were in work, the employment rate rose from 38% in 2014/15. In contrast to the stereotypes, just 7% were unemployed.
On the same basis, some 28% of social renters were retired and 21% economically inactive but not in full-time education.
6) Disabilities: Almost half of social renter households have at least one member with a long-term illness or disability.
That rate is much higher than for owner-occupiers (29%) and private renters (23%) and it’s a graphic illustration of the discriminatory impact of the bedroom tax.
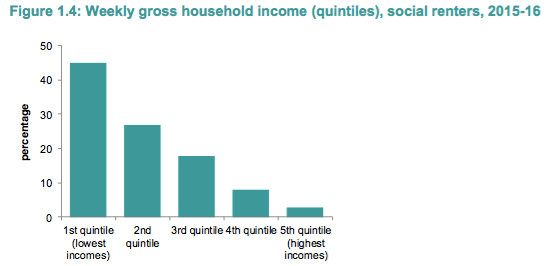
7) Incomes: The average (mean) weekly income of social renters was £394 in 2015/16, much lower than for private renters (£673) and owner-occupiers (£919).
Seven out of ten social renters were in the two lowest income quintiles, with just 3% in the highest, illustrating again the pointlessness of Pay to Stay.
8) Rents: The mean weekly social rent was £101 and on average social renters spent 28% of their household income on rent (37% excluding housing benefit). More than half of social renters (59%) were in receipt of housing benefit but that was down from 63% in 2014/15.

A quarter of social tenants were either currently in rent arrears or had been in the previous 12 months. That compared with 9% of private renters.
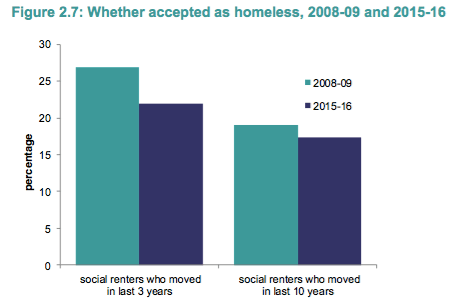
9) Homelessness: 17% of households who had moved into social renting within the last 10 years had been accepted as homeless before moving in, which was down slightly on 10 years ago.
However, among social renters who had moved in to their home in the last three years, the proportion fell from 27% to 22%.
10) Waiting for a home: Social renters who had lived in their home for less than 10 years were asked how long they’d had to wait for it.
Surprisingly perhaps, for 42% the wait was less than three months and for 72% it was less than a year. Only 5% had waited for between five and 10 years and 1% over ten years.
11) Aspiration to buy: More social renters (27%) expected to buy a home in future, up from 24% in 2014/15. That reverses a decline in expectation about buying.
That could reflect the government’s pledge to extend the Right to Buy to housing association tenants, with the proportion expecting to buy their current home increasing from 35% in 2010/11 to 47% in 2015/16.
12) Moves: Social renters had lived in their home for an average of 11.6 years, which puts them midway between owner-occupiers (17.8 years) and private renters (4.3).
However, they are just as likely to move as people in other tenures.
Out of the 324,000 moves in to social renting in 2015/16, 158,000 came from within social housing, 84,000 were from private renting, 60,000 were new households and 21,000 had previously owned their home.
Just 19,000 social renters became owner-occupiers and 52,000 became private renters.
13) Satisfaction: The majority of social renters (81%) were satisfied with their accommodation but they were more likely than people in other tenures to be dissatisfied or very dissatisfied and less likely to feel safe in their neighbourhoods.
Most were satisfied with their status as social renters and they were much less likely than private renters to be dissatisfied with their status (10% compared to 21% for private renters).
However, more social renters (22%) were dissatisfied with repairs and maintenance carried out by their landlord than private renters (18%). The dissatisfaction rate was 25% among council tenants.
The full report with much more detail, plus similar reports on the other tenures and other aspects of English housing, is available from the DCLG website here.
