Where the money really goes in housing
Posted: March 21, 2018 Filed under: Affordable housing, Help to Buy, Home ownership, Housing benefit, Private renting, Social housing | Tags: UK Housing Review Leave a commentThree comparisons leap out from the latest edition of the indispensable UK Housing Review published on Wednesday.
The first two are not new in themselves and the third is only a crude estimate but all three need repeating again and again for a real appreciation of where spending on housing goes and exactly who is subsidising who.
First comes the main one highlighted by the Chartered Institute of Housing (CIH): the shift from bricks and mortar to personal subsidies, or from grants for new homes and repairs to old ones to housing benefit.
This series of pie charts from the Review shows the change over the last 40 years and the total amount of housing subsidies in real terms:

Note first that supply subsidies have sunk to just 4.3 per cent of the total pie – this despite all the cuts in housing benefit seen since 2010 and the fact that the figures to not include continuing tax reliefs for home owners (see below for more on that).
Second, note that this does not save money. Total subsidies are now 48 per cent higher in real terms than at the turn of the century (when admittedly social housing investment was very low) but they are also approaching the levels of 30 years ago (when investment was significantly higher and the unemployment rate was three times what it is now).
This graph shows social housing investment across the UK in real terms and in long-term perspective.
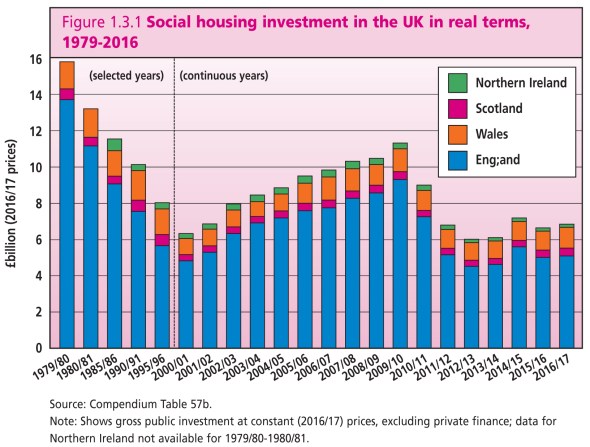
True, the total has recovered from the nadir of 2012/13 and is now a little higher than when New Labour was sticking to Tory spending plans in 2000/01, but most of the ground lost since 2010 has not been recovered.
The second significant comparison is the balance between subsidies for the private sector and for affordable homes.
Again this is not new but it is important because it takes account not just of grant and direct spending but also of the increasing use of loans and guarantees since 2010.
Total support for affordable housing from 2017/18 to 2020/21 currently stands at £11.2 billion, which comprises £10.2 billion of grant and £1 billion of loans in the form of extra local authority borrowing headroom.
However, for every £1 available for affordable housing we are spending £4 on the private market.
The total there stands at £41.9 billion over those four years, including £7.6 billion of grant, £26.2 billion in loans and £8 billion in guarantees.
True, those guarantees will be called in and the loans will be repaid, but the comparison shows that the heavy bias towards the private market continues despite the pause in more extreme policies such as starter homes.
The third comparison is the overall subsidy going into social housing, private renting and home ownership.
This is an immensely complicated calculation as it has to compare very different things in capital and revenue subsidies, loans and guarantees and taxes and tax reliefs and the Review only claims this is a crude assessment.
Counting housing benefit and investment alone, the total subsidy going into social housing currently stands at £20 billion a year.
Include (more controversially) economic subsidy from sub-market rents and the value of section 106 obligations and the total rises towards £30 billion a year.
Next up is the private rented sector, which receives around £9 billion a year in housing benefit payments and around £1 billion in loans and guarantees for new development.
However, its net financial position is broadly neutral since it also currently pays around £8-9 billion into the tax system and new taxes are being introduced.
Finally comes home ownership. For all its self-reliant image, once you take away tax reliefs from taxes paid, the sector receives more than £29 billion a year. (I assume this includes, for example, relief from capital gains tax for main residences, which currently costs more than housing benefit).
Add another £5 billion in loans and guarantees and the total of £34 billion a year makes it the most subsidised sector of all.
You can find all of that plus the usual comprehensive compendium of statistics and many more insights from commentary on key housing issues in the UK Housing Review.
The 2018 edition by Mark Stephens, John Perry, Steve Wilcox, Peter Williams and Gillian Young is being launched today (Wednesday). Some of it will eventually be available online here but you can order the full print edition here.
