What the English Housing Survey says about private renting
Posted: August 2, 2018 Filed under: Private renting | Tags: English Housing Survey 1 CommentOriginally posted on August 2 on my blog for Inside Housing.
The second in a series of blogs looking at the latest English Housing Survey considers the state of the private rented sector in 2016/17.
Home to a fifth of us
The private rented sector has doubled in size over the last 20 years from 10% of households in 1996/97 (2.1m) to 20% in 2016/17 (4.7m). Most of the growth took place after 2003.
To put that growth into perspective, the private rented sector now accommodates a greater share of households than at any time since 1970. As recently as 1997, following rapid decline in the 1970s and 1980s, it was half the size of the social rented sector.

Generations Rent?
Our idea of Generation Rent – the notion that the growth of private renting heavily concentrated among the under-35s – is now looking a bit out of date.
It partly depends on whether you look at the number of households in each age group – given the increase in the sector highlighted above, it’s hardly surprising that private renting grew among all age groups except the over-75s in the last 20 years – or the proportion.
The number of 35-44 year old households who are private renters has tripled in 20 years to 1.1m and they now account for 24% of households in the sector compared to 16% in 1996/97. By contrast, 16-24s fell from 24% to 16% over the same period and the proportion of 25-34s living in the sector has remained stable at 32%.

In front of the children
The same contrast is evident when we look at different types of household, with growth in numerical terms seen across the board but proportionately highest among couples and lone parents with dependent children.
One-person households accounted for 37% of private renters 20 years ago but just 27% now while three- and four-person households saw significant growth.

Incomes and rents
As with social tenants, more private renters are in work (63% full-time and 13% part-time in 2016/17) than 20 years ago (54% full-time and 9% part-time). Alongside that, there has also been a marked decline in the proportion of private renters who are retired (14% to 9%) and unemployed (9% to 4%).
However, where social renting is heavily concentrated in the lowest two income quintiles (73% are in the lowest 40% of earners), private renting is much more evenly spread across the income distribution. The proportion of private renters in the lowest income quintile has fallen from 29% ten years ago to 21% – putting even more strain on social housing.
The mean private rent was £196 a week in 2016/17, almost double the mean social rent of £102.
However, incomes in the sector are also much higher: £617 a week for the head of the household and their partner compared to £354 for social renters; and £696 a week in household income compared to £403.
Some 22% of private renters received housing benefit in 2016/17, of whom almost half were working. Only 19% of those receiving housing benefit said it fully covered their rent (compared to 51% of social renters).
Private renters were much less likely to be behind with their rent (9% in 2016/17) than social renters (28%).
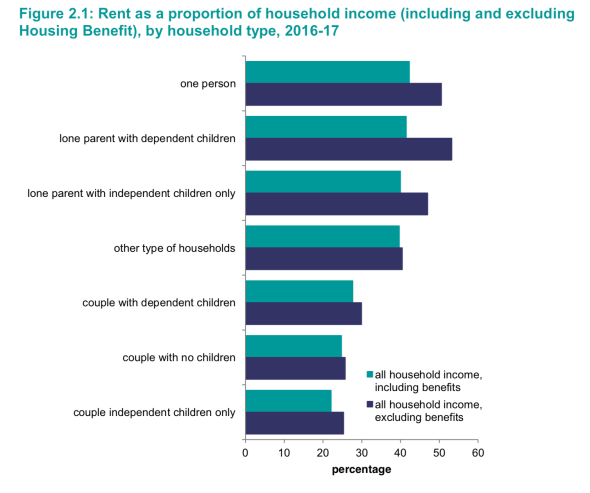
They spent 34% of their household income on their rent including housing benefit and 37% excluding housing benefit. Both these figures are higher than for social renters, despite their lower incomes.
The rent burden was unsurprisingly highest for private renters in London and for lone parent households with children.
What was that about the bedroom tax?
When ministers introduced the bedroom tax they never tired of reminding us that they were only doing the same as Labour did in the private rented sector when it brought in the Local Housing Allowance.
The rules were of course very different and the restrictions only applied to new tenants but it’s still interesting to see what has happened to under-occupation (on the English Housing Survey’s more generous definition).
Over the last 20 years, under-occupation in the private rented sector fell from 17% to 15% but it fell much faster in social renting (from 12% to 8%). By contrast it increased among owner-occupiers from 39% to 51%.
A mixed picture on tenant satisfaction
As I highlighted in the first blog in this series, private renters are more satisfied with their accommodation and the way their landlord carried out repairs than social renters.
However, private renters come up with a very different answer when they are asked about their tenure. Here they are much less satisfied (68% very or fairly satisfied) than social renters (83%) and owner-occupiers (98%).
On the move
Just over half of households who moved home in 2016/17 were private renters (up from a third 20 years ago).
Churn (moves within the sector) increased from 465,000 households and 57% of private rented sector moves in 1996/97 to 860,000 and 72% in 2016/17. This reflects the sector’s traditional role and its short-term tenancies. However, this number has been falling recently – there were a million moves within the private rented sector in 2014/15.
On average, private renters had lived at their current address for 3.9 years. This spell ranged from less than a year for under-25s and 2.3 years for 25-34s to 9.1 years for 65-74s and 17 years for over-75s, some of whom will still have pre-1996 secure tenancies.
Asked why they moved, private renters were most likely to cite job-related reasons (16%), wanting a larger home (13%) and wanting to move to a better neighbourhood (11%). All of these came ahead of being asked to leave or given notice by their landlord (10%).
While the private landlord lobby will highlight those results in the political battle over the need for longer tenancies, we may hear rather less from them about the main reason for moving given by private renters aged 65-74. Of those who had moved in the last three years, 30% said it was because of their landlord giving notice.
Conditions improve
Physical conditions in the sector have improved markedly in the last 20 years, partly reflecting a rise in the number of newer homes in the sector.
In 1996, for example, 39% of private rented homes were rated in the bottom two energy efficiency bands. By 2016, that proportion had fallen to 7%, which may also reflect the fact that new lettings of Band F and G homes have been banned since April 2018.
Over the last 10 years, the proportion of private rented homes that are non-decent has fallen from 47% to 27%. However, before the sector gets too complacent it might want to consider first that the non-decent rate was half that in the social sector and second that the numberof non-decent homes has remained constant.

So, a myth about longer tenancies and the reasons tenants leave. Only 10 % being asked to by landlords, whilst elsewhere we see much higher percentages of private sector tenants in rent arrears.
Also, massive bias against the PRS, with energy efficiency standards and Gas safety certificates Not enforced against Social landlords, not to mention not being subject to Licensing.
One could be forgiven for assuming the Government was trying to even the score against PRS providing better homes by trying to PRICE them out of the game with Sec 24, Stamp duty, Licensing, to mention but a few.
Still, the govt oblivious to the reducing PRS with no other alternatives to pick up the Housing shortfall from the above and 100,000 + loss of beds through Minimum room sizes.