What the English Housing Survey says about owner-occupation
Posted: August 13, 2018 Filed under: Uncategorized 2 CommentsThe third in a series of blogs looking at the latest English Housing Survey considers the state of home ownership in 2016/17.
Home ownership has stopped shrinking
The survey says 62.6% of households owned their home in England in 2016/17, down from 62.9% the previous year. Coming after a 10-year decline from a peak of 71% in 2004, that represents relative stability and the rate is now little changed since 2013/14.
The last time home ownership was lower was in 1984, just as the Thatcher right to buy boom was at its peak.
Or has it?
However, some more profound changes are going on beneath the surface. First, it depends whether you are talking about owner-occupation or home ownership – many more of us now own more than one home thanks to buy to let.
Second, it conceals the widening divide within ownership. Traditionally owner-occupation has been about first-time buyers getting on to the housing ladder but the tenure has matured as baby boomers get older and there are now more outright owners (34%) than people buying with a mortgage (28%).

In line with that, the proportion of owners who are under 35 has halved in the last two decades from 18% to 9% and even buyers with a mortgage are older than they once were (only 46% are under 45). By contrast, 61% of outright owners are over 65.
In case you were wondering, only 1% of all owners (136,000) are shared owners and a surprisingly high 21% of them are over 65, suggesting that they will never make the transition to full ownership.

Note: The survey takes account of the age of the Household Reference Person (HRP) or head of the household.
Children
In the late 20thcentury, many people got a house and a mortgage when they had kids.
That is still true to some extent: a higher proportion of mortgaged owners are couples with children (40%) than in any other tenure (it’s 24% for private renters and 17% for social renters).
However, the proportion of owner-occupiers with children has fallen slightly in the last 20 years at the same time it has risen significantly among private renters.
Lone parents with kids make up just 2% of home owners.
Earnings
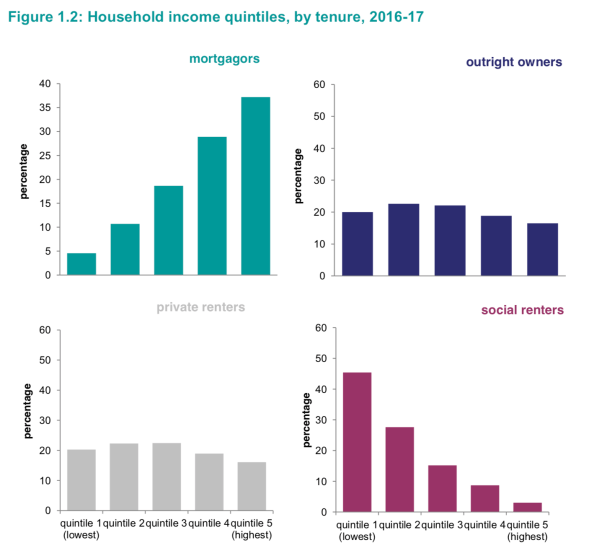
Owners unsurprisingly earn more than renters: some 66% of mortgaged owners and 40% of outright owners (the figure is lower because so many are retired) compared to 35% of private renters and 12% of social renters are in the top two income quintiles.
Affordability
The average mortgage payment in 2016/17 was just £159 a week – lower than many ‘affordable’ rents.
That conceals considerable variations between big and small mortgages – 24% paid more than £200 a week and 22% less than £79 – but when combined with owners’ higher incomes it makes owner-occupation by far the most affordable tenure.
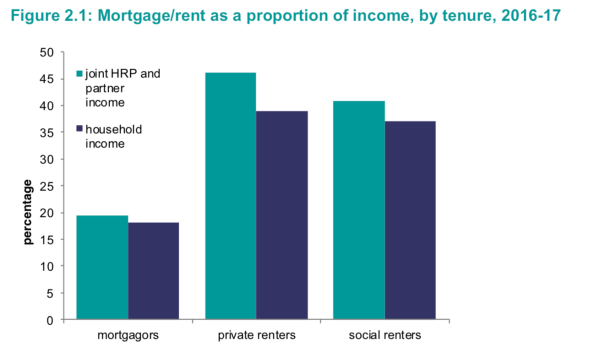
Excluding outright owners (who have paid off their home loan), mortgaged owners spent just 19% of their joint income on repayments whereas rent accounted for 39% of social renters’ and 49% of private renters’ income.
The proportion of income devoted to housing costs has not changed much for owners in the last 10 years, presumably because lower mortgage rates have cancelled out the higher house prices they have helped to generate.
Looking at the income of the whole household rather than the joint income of the Household Reference Person and their partner makes some difference but the pattern is the same.
Less than 1% of mortgaged owners were in arrears at some stage in 2016/17, compared to 9% of private and 25% of social renters.
On the move
The decline of mortgaged ownership over the last 20 years is obviously matched by the rise of private renting – but it has also had profound consequences for house moves.
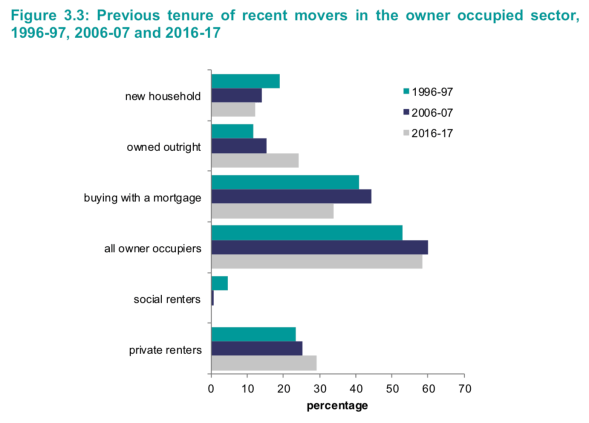
The number of new households moving into owner-occupation has fallen from 857,000 to 625,000 and the number of new mortgaged owners has fallen even faster from 732,000 to 397,0000.
As the graph shows, outright owners and private renters now account for higher proportions of recent movers whereas the proportion who were social renters has fallen from 5% 20 years ago to a proportion too tiny to classify.
At the same time, people are staying in their home longer than they once did: the mean length of residence in their current accommodation among owners is now 17.5 years;
Only 4% of owners say they intend to move in the next six months, meaning that owners who are traditionally meant to climb up the housing ladder now look much less mobile than private renters (18%) and social renters (7%).

Fig 2.1 – Mortgages in Arrears, ( Private Renters ? – I take it that’s Buy-to-let mortgages ?
Pretty sure it will be owner-occupier mortgages as EHS is based on the household