The state of the housing nation 2023
Posted: December 18, 2023 Filed under: Bedroom tax, Energy efficiency, Private renting, Tenants, Tenure change | Tags: English Housing Survey Leave a commentAs 2023 draws to a close, what is the state of the housing nation?
As always, the best place to start is the English Housing Survey, which has just published headline results for 2022/23. Here are five things that caught my attention.
1 The tenure and wealth gap
The results of the survey need to be treated with more caution than usual when comparing the results this year thanks to the impact of the pandemic, but the general trend on housing tenure is pretty clear.
Thanks in part to Help to Buy and other government schemes, the proportion of households who own their own home (64 per cent) has stabilised while the relentless growth of the private rented sector (18 per cent) has slowed. The social housing sector is still in slow decline but there is a significant difference between London (where it is home to 21 per cent of households) and England as a whole (16 per cent).
There were 874,000 recent first-time buyers in 2022/23 and they had an average (mean) deposit of just over £50,000.
Given that, it’s not surprising that family wealth has become increasingly important to people’s chances of buying. A growing proportion received help from family or friends (36 per cent, up from 27% in 2021/22 and 22 per cent in 2003/04) while 9 per cent used an inheritance for a deposit.
They were also higher earners: the majority of successful first-time buyers (58 per cent) came from the top two income quintiles and only a small minority (16 per cent) came from the bottom two.

2 Unaffordable renting
Buying with a mortgage was significantly more affordable (19 per cent of household incomes) than private or social renting.
Rent payments accounted for 29 per cent of joint income for social renters and 40 per cent for private renters when housing support is included. Excluding housing benefit, the average proportion of income spent on rent was 37 per cent for social renters and 46 per cent for private renters.
The gap between owning and renting shown in these results for 2022/23 does not of course reflect recent sharp increases in interest rates but it does illustrate the impact of a decade and a half of ultra low rates on relative affordability. This effect has been compounded more people being forced to rent as it’s become harder to get a mortgage.
In 2022-23, 59 per cent (2.4 million households) of social renters and 24 per cent (1.1 million households) of private renters received housing support to help with the payment of their rent.

The impact of years of welfare reform and cuts such the bedroom tax is perhaps evident in the breakdown of social renters getting housing support. Counter to the general narrative about welfare, that 59 per cent receiving housing benefit is significantly lower than in 2012/13 (66 per cent).
Over a third (36 per cent) of working social renters received housing support in 2022/23, an increase compared to 2021/22 (30 per cent). This proportion was lower for private renters, where 17 per cent of working private renters received housing support in 2022/23 but an increase compared to 2019-20 (11 per cent).
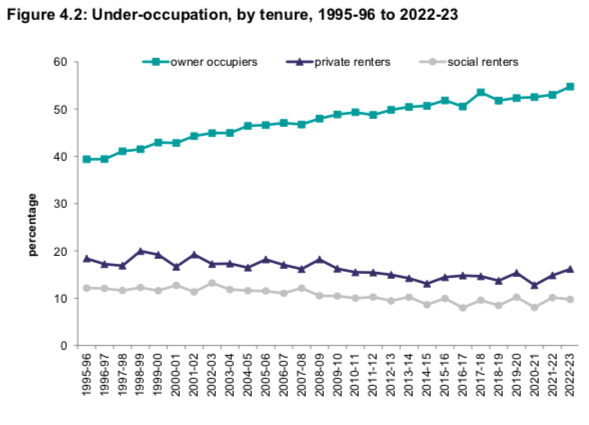
3 Over-crowding and under-occupation
One of the ways that the government justified the bedroom tax when it first imposed it in 2013 was that it would help to reduce under-occupation and over-crowding in social housing.
Things have not worked out like that. Owner-occupiers and private renters are less likely to be over-crowded than in 2013/14 but the proportion of social renters who are over-crowded has risen from 6 per cent to 8 per cent.
Under-occupation always was much more prevalent among owner occupiers than in the rented sectors. Over half (55 per cent) of owner occupied households (8.7 million households) were under-occupied in 2022-23 compared with 16 per cent of private rented (743,000) and ust 10 per cent of social rented (391,000) households.
That proportion of under-occupying social renters has fallen only very slightly since the bedroom tax was imposed.
4 Some good news on conditions
It’s not all bad news in the English Housing Survey, which also has data showing significant improvements in the quality of the housing stock.
These include the proportion of homes that are non-decent or have health and safety hazards. The private rented sector remains the worst in both these categories, with 21 per cent non-decent (twice as many as in social housing) and 12 per cent with Category 1 hazards (three times as many).
Counter to that, problems with damp have increased slightly in housing as a whole since 2018 after years of decline, perhaps a result of people turing down their heating as energy costs rose. A small increase in damp problems in social housing is not seen as statistically significant.
Damp problems were more prevalent in private rented dwellings (9 per cent in 2022), compared to 5 per cent of social renters and just 2 per cent of owner occupiers.
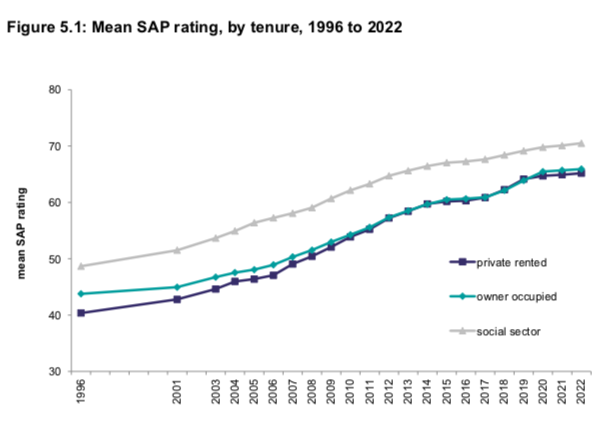
A much more definite trend is that our homes are much more energy efficient than they were a decade ago. The proportion of dwellings in the highest Standard Assessment Procedure (SAP) energy efficiency rating (bands A to C) increased between 2012 and 2022 from 19 per cent to 48 per cent. The social rented sector saw the largest increase from 36 per cent in 2012 to 70 per cent in 2022. This graph shows the improvement in average SAP ratings since 1996.
5 Lonely social tenants
If homes are generally in better condition, what about the people living in them?
The English Housing Survey has only asked people about loneliness since 2019/20. Understandably, there was a sharp increase during the pandemic but some of that impact has continued afterwards.
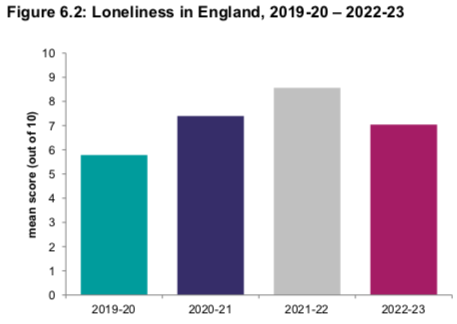
There is also a stark and worrying difference between tenures.Some 15 per cent of social renters were twice as likely to often or always feel lonely. That means they were twice as likely to feel lonely as private renters (7 per cent) and three times as likely as owner-occupiers (5 per cent). Some food for considerable thought there for social landlords.
