The ‘problem of rent’ has just got worse
Posted: January 25, 2022 Filed under: Housing benefit, Welfare state | Tags: Beveridge, Joseph Rowntree Foundation, Resolution Foundation Leave a commentOriginally written as a column for Inside Housing.
The UK has among the lowest levels of basic benefits in the developed world but spends more than any other country on housing benefits.
The two statements, which come from a new report by the Resolution Foundation, are of course connected and they are the result of deliberate policy choices over decades.
The first relates to the way that the benefits system evolved in the wake of the Beveridge report with low levels of working-age benefits supplemented by extra support for housing, children and ill-health.
Beveridge had confessed that he was unable to solve what he called ‘the problem of rent’ – how you account for housing costs that vary between different areas – in his blueprint for social security after the Second World War.
His fudged solution was to add a flat rate housing allowance to contributory unemployment benefit but that was rejected in favour of means testing in the scheme that was introduced.
However, his whole report was written on the assumptions that full employment, mass council housebuilding and private sector rent control would continue.
By contrast, most European countries have more generous contributory and earnings-related benefits supplemented by a means-tested safety net.
This graph from the report shows the difference:

For clarity it’s worth pointing out that this is based on the OECD definition of housing benefits in kind, which includes payments for housing costs but not mortgage tax relief (still paid in some countries) or capital investment in social housing or the ‘subsidy’ of the lower rents it produces.
The second policy choice dates back to the deregulation of rents and decline of social housing in the 80s and 90s – reversing those assumptions made by Beveridge – and more recent falls in home ownership among low-income households that have left them paying higher rents.
Read the rest of this entry »The £3 trillion question
Posted: December 10, 2021 Filed under: Housing market, Inequality, Tax | Tags: Resolution Foundation Leave a commentOriginally written as a column for Inside Housing.
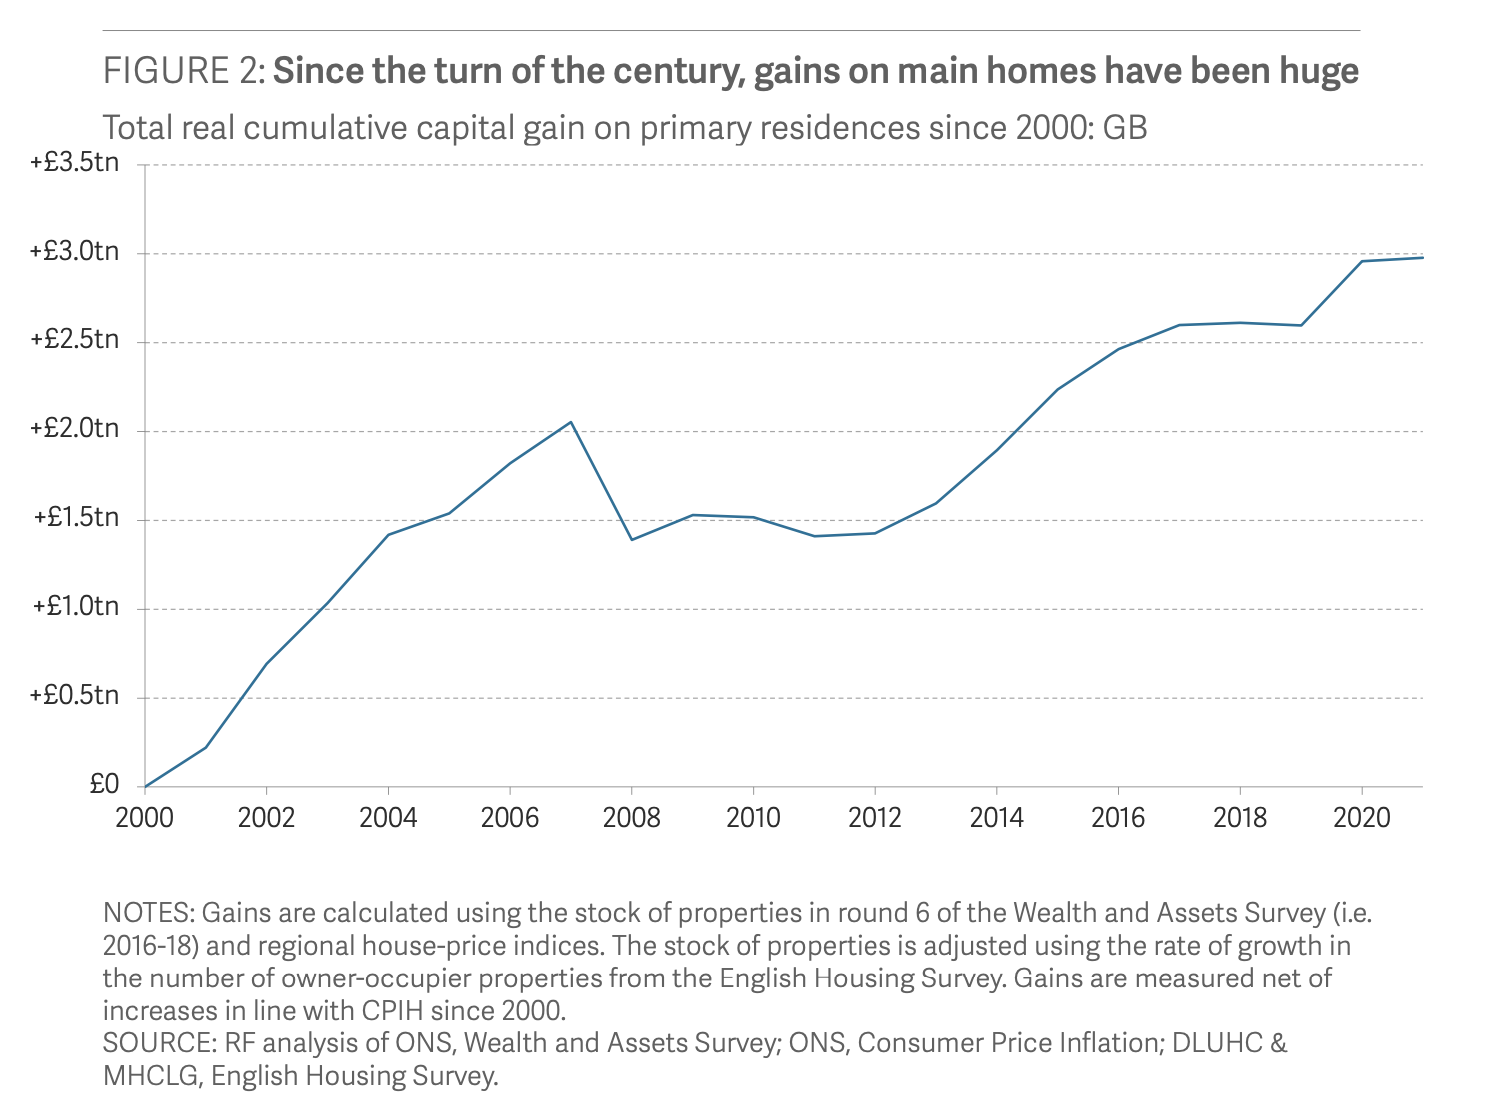
It has so many zeros in it that it’s worth writing it out in full: £3,000,000,000,000.
That’s the increase in the housing wealth of British households since 2000, according to new analysis from the Resolution Foundation. Perhaps even more remarkably, as the graph below shows, around half of that has been (un)earned since 2012, in the wake of a Global Financial Crisis that seemed set to bring the whole market crashing down.
The distribution of all that housing wealth has been startlingly unequal. Londoners gained almost four times as much (£76,000) as those in the North East (£21,000) and the over-65s eight times as much as 30-34 year olds and more than three times as much as 35-39 year olds.
Where the least wealthy third of households gained less than £1,000 per adult, the wealthiest 10 per cent chalked up an average gain of £174,000.

Needless to say, the gains for anyone who has remained a social tenant or a private renter are zero and zero – and less than zero for leaseholders unlucky enough to be stuck in unmortgageable and unsaleable flats.
Read the rest of this entry »Age, class and home ownership
Posted: February 16, 2018 Filed under: Home ownership, Inequality, Mortgages | Tags: IFS, Resolution Foundation Leave a commentOriginally published on my blog for Inside Housing on February 16.
Housing is so often presented as a story of inequality between the generations but what about inequality within generations?
Analysis published on Friday by the Institute for Fiscal Studies confirms the familiar story of the collapse of home ownership among younger people that has been accompanied by a surge in private renting and adults still living with their parents into their late 20s and early 30s.

The IFS briefing concentrates on people aged 25-34, exactly the age group who could once have been expecting to take their first step on to the housing ladder.
The collapse has obviously been biggest in London but home ownership rates have fallen even in the cheapest regions like the North East and Cumbria.

